Introduction
Spectroscopy is a measurement technique that examines the properties of a material by measuring how the material interacts with light at different wavelengths. In general, this information is obtained non-destructively – the material is not damaged, destroyed, or altered in the measurement process. Several different types of interactions can be measured, including absorption, reflection, and emission of light by the material. A material can be characterized by how much light energy is absorbed and at which wavelengths energy is absorbed. The wavelengths that are absorbed are dependent on the components – fat, protein, and sugar molecules of varying types– and the strength of absorption is dependent on the concentration of the components within the material. A material may also be characterized by the strength and wavelengths of light reflected from its surface layers, which are determined by the components present and by the properties of the surface itself. In some cases, materials can emit light at one or more unique wavelengths when they are illuminated by an external energy source. These can include molecules or substances that are fluorescent, which can be found in a variety of plants and animals. In each of these interactions, the way in which the optical power collected from the sample material varies with wavelength contains important information about the material.
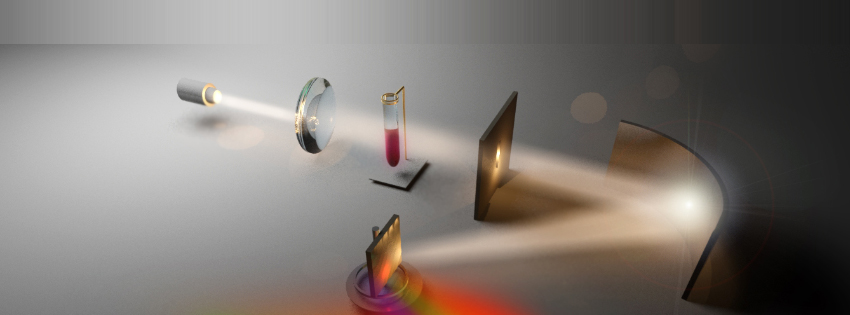
Spectroscopy is performed using a device called a spectrometer. The measurement process in all spectrometers begins in the same manner, and is shown in Figure I.1. An optical source produces optical power over a range of wavelengths. An optical system directs the light from the source to the material under investigation. The light that is transmitted (as shown in Figure I.1), reflected, or emitted by the material is captured by a second optical system and directed toward the input of the spectrometer. The captured light is passed through a small entrance slit that controls the resolution of the instrument and the angles at which light enters the optical processing system of the spectrometer. The light is then imaged using a lens or mirror onto a diffraction grating. The diffraction grating is an element designed specifically to reflect light at different wavelengths at different angles, so that the light leaving the grating is spread out in wavelength over space like a rainbow. This wavelength separation allows other systems to examine the light on a wavelength-by-wavelength basis and produce the desired plot of the optical power as a function of wavelength that contains information about the material under test.
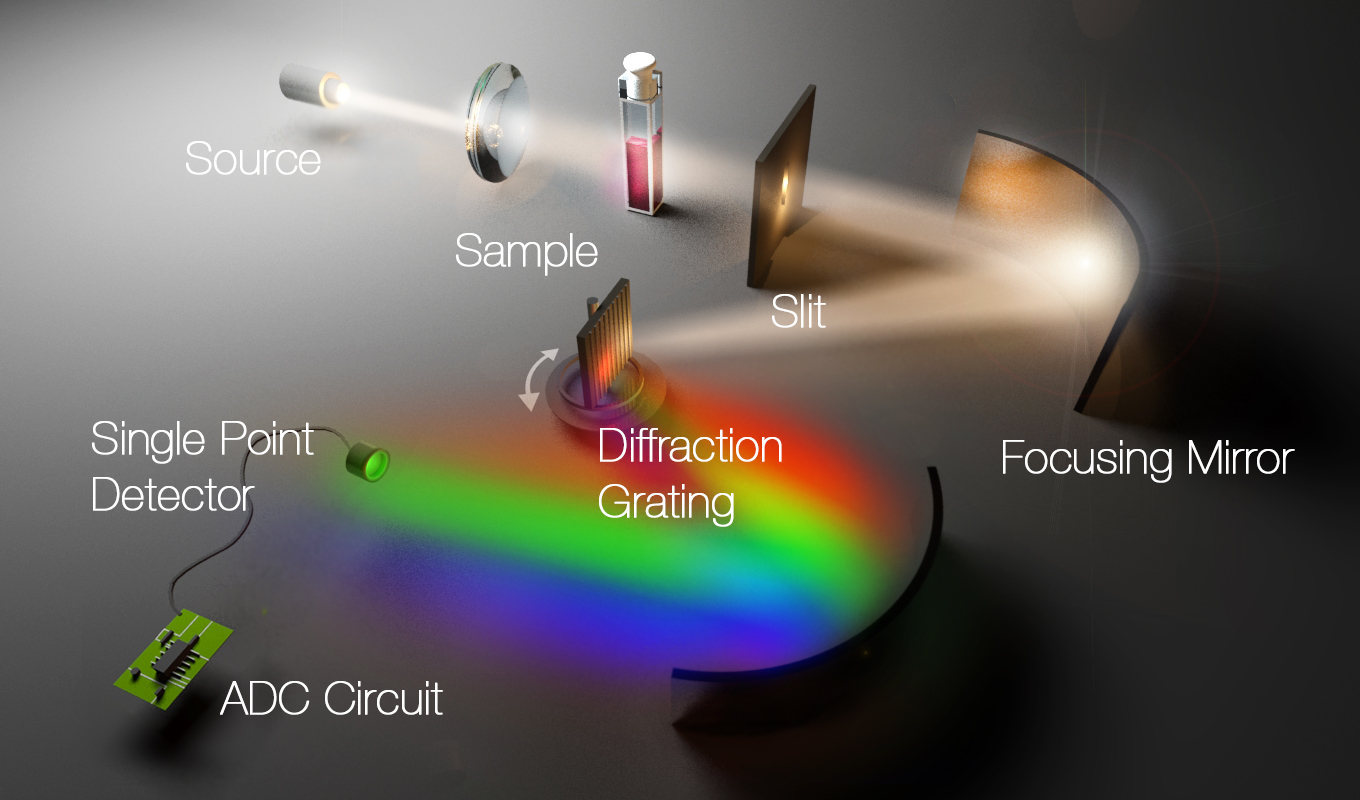
Figure I-1: The rotated grating approach to making spectroscopic measurements.
There are two traditional methods used to perform the wavelength-by-wavelength analysis of the light from the grating. The first method involves physically rotating the diffraction grating to direct each wavelength in turn to a focusing mirror that directs the optical power onto a single element (or point) detector, as shown in Figure I.1. The power in each wavelength is converted into an electrical signal by the detector. A combination of timing signals, control circuitry, and firmware is used to correctly correlate each signal from the detector with the wavelength that was incident on the detector during the measurement. High resolution is obtained in this method by implementing a high angular resolution rotation system and the use of a small-area detector, which limit the portability and the optical power throughput of the spectrometer, respectively. The second method uses a fixed diffraction grating and the light from the focusing element is collected by a linear array of detectors as shown in Figure I.2. A known, small range of wavelengths is incident on each detector. The power as a function of wavelength can be reconstructed by plotting the signal from each detector against the wavelength range the detector represents. High quality algorithms adapted from digital cameras produce detailed reconstructions, though the size and spacing of the detector elements in the array dictates the minimum attainable resolution. Smaller detector elements increase resolution at the cost of collecting less optical power from the diffraction grating. The method also depends on the ability and cost of constructing arrays that are sensitive to the wavelengths of interest. Both methods have been well studied and successfully applied in a wide variety of applications.
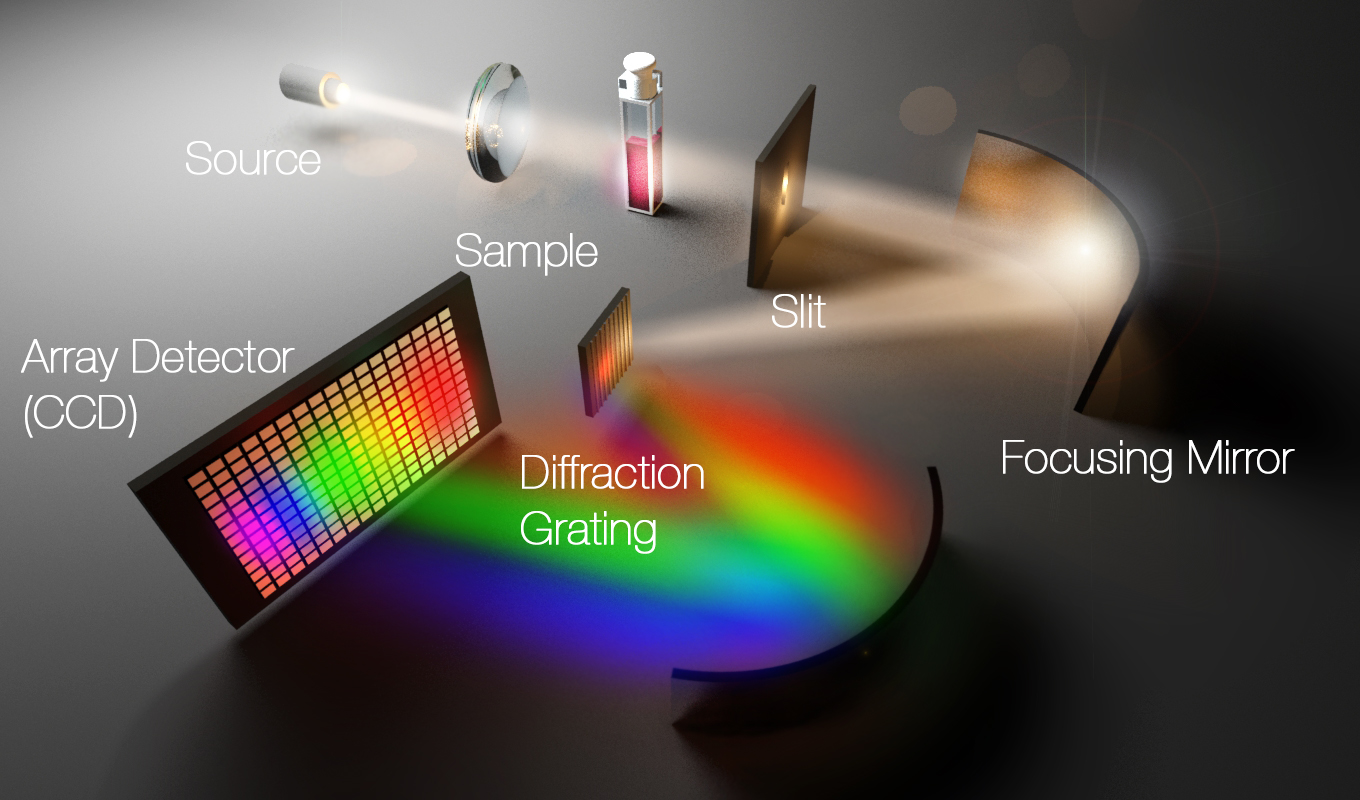
Figure I-2: Linear array of detectors-based approach to making spectrographic measurements